How Local Rankings Change Block by Block: A GeoGrid Study
There is no single place you rank on Google Maps. Your position is recalculated for every searcher based on where they stand — so a one-number rank check hides most of your real visibility. This study shows what that looks like on a grid, and what to do about it.
The finding
A #1 ranking at your door can be invisible across town
When you check a Google Maps rank from a single location, you almost always see your best-case position — the one measured closest to your business. Sample the same keyword at dozens of points across a service area and a different truth appears: rankings tend to be strongest near the business and decay with distance, often dropping out of the map pack entirely within a mile or two. The grid below is an illustrative example of that pattern.
Example A — the flattering center
8% top-3 coverageIllustrative 5×5 grid. #1 at the center (highlighted), red across most of the map. A single rank check would report only that green center.
Why it matters:the single number this business would report — “we rank #1” — is true at exactly one point and false across most of the area their customers actually come from. Coverage, not position, is the honest metric.
The method
What a GeoGrid is
A GeoGrid lays a grid of search points over the map around a business — commonly 5×5, 7×7, or 9×9. At each point it runs a rank check for a target keyword as if a customer were searching from that exact spot, then colors the cell by position: green for the top of the local pack, yellow for mid, red for invisible. Instead of one number, you get a map.
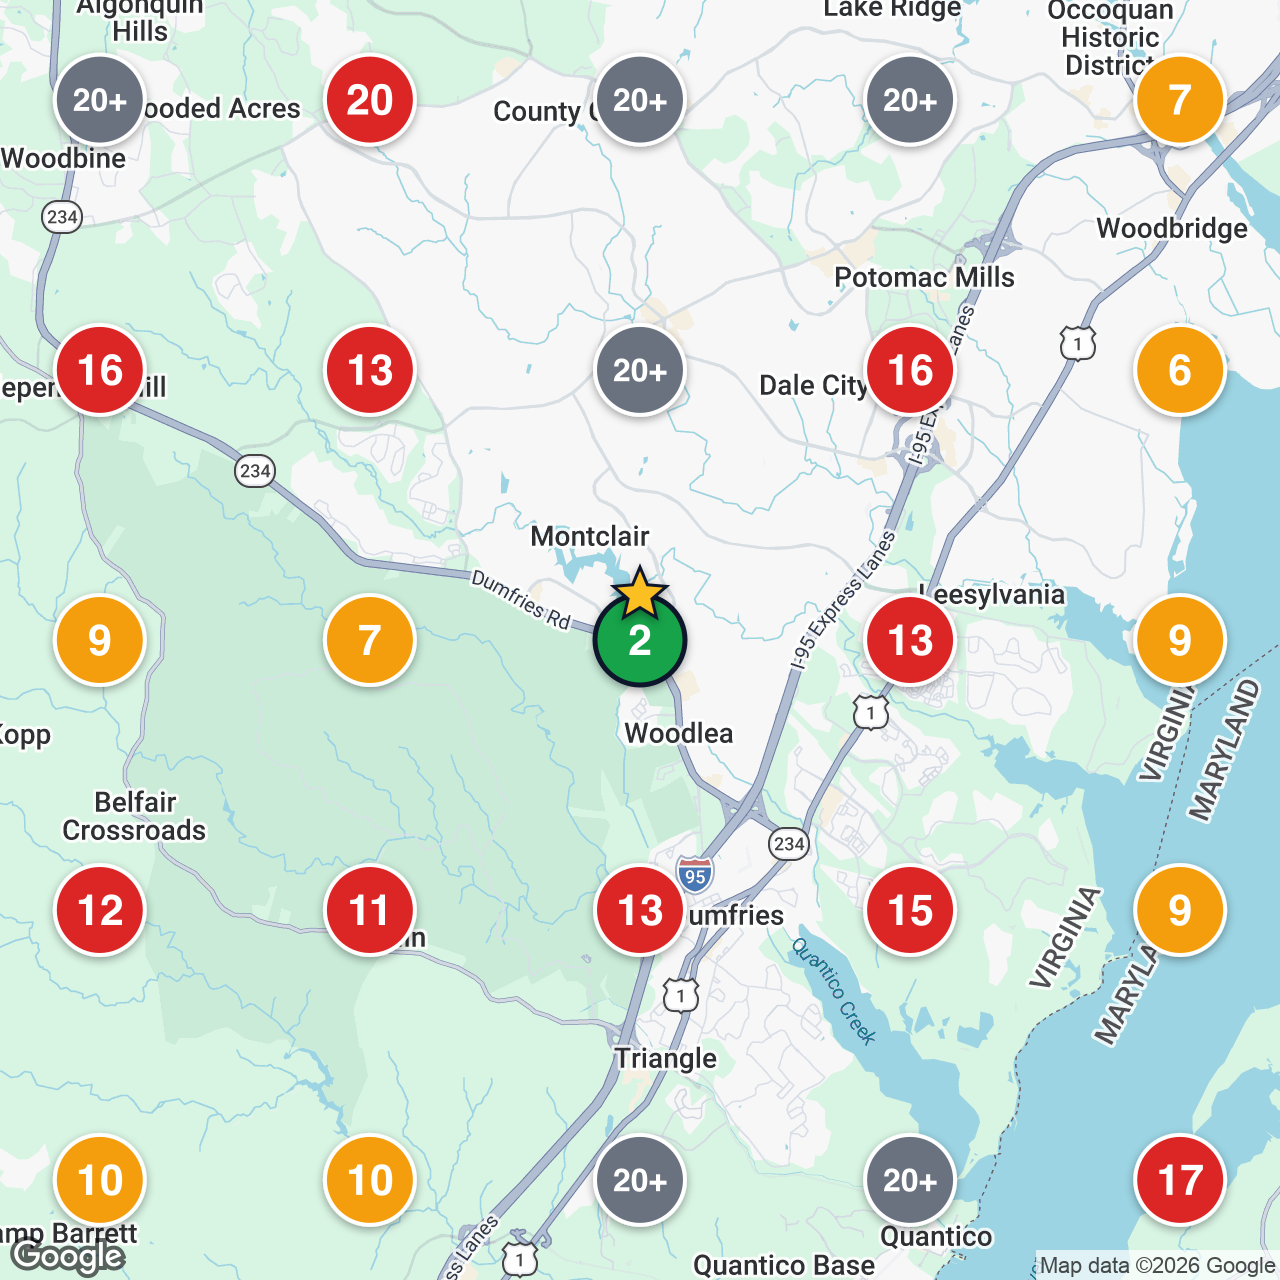
Actual report output — 5×5 grid, real rankings. View a sample report (PDF)
Grid of points
25 to 81 search points across a chosen radius.
Real local searches
A rank check at each point, from that exact location.
Coverage over time
Re-run the grid to watch green spread as you improve.
Why it happens
Why proximity drives the pattern
Google’s local ranking rests on relevance, prominence, and distance. That last factor — proximity — is why rank moves block by block. All else roughly equal, Google favors the closest good option, so as a searcher moves away from you the distance signal works against you and for whoever is now nearer. Your relevance and prominence don’t reset; they simply have to overcome a growing distance penalty until, at some point, they can’t.
Example B — a competitor's red pocket
24% top-3 coverageIllustrative grid. A strong zone with a cluster of red where a closer, well-reviewed competitor owns one neighborhood.
Decay isn’t uniform. If proximity were the only factor, coverage would be a clean circle. It never is — competitor density, your relevance strength, and prominence all bend the shape.
Red pockets name your real rival. A red cluster inside a green zone means a specific competitor is beating you right there — the most actionable pattern on any grid.
A wider radius is earned. Stronger relevance and prominence let your green reach further before distance wins.
What to do
What businesses should do about it
You can’t move your building, so proximity is fixed — but the radius your relevance and prominence can reach is yours to grow. The goal isn’t to rank #1 everywhere (impossible — someone closer always wins the far edges); it’s to widen your green zone to cover where your customers actually are. The grid below is an illustrative “after” version of Example B, showing green spreading as those signals improve.
Example C — after widening relevance
52% top-3 coverageIllustrative grid. Same area as Example B after category, review, and profile work: green covers far more of the map, the red pocket is reclaimed.
- 1
Nail your primary category. The strongest lever you control — it directly widens where you are relevant.
- 2
Build review velocity. A steady stream of recent, keyword-rich reviews raises prominence and effective reach.
- 3
Complete and work the profile. Services, photos, hours, description, Q&A, and regular posts compound into relevance.
- 4
Attack your red pockets. Identify the competitor winning a neighborhood, then out-optimize them for that area.
Methodology note
The Example A–C heatmaps on this page are illustrative examples. They are representative grids constructed to demonstrate common patterns in local search — a flattering center, a competitor’s red pocket, and an improved “after” state. They are not real customer data, and the numbers in each cell are example map-pack positions, not measurements from any specific business.
A real GeoGrid works exactly as described here: it overlays a grid of points (typically 5×5 to 9×9) across a service area, runs an actual Google Maps rank check for a target keyword at each point as if searched from that location, and colors each cell by the resulting position. “Top-3 coverage” on the example grids is the share of cells ranking in positions 1–3.
The mechanism the examples illustrate — rankings strongest near the business and decaying with distance, bent by competitor density, relevance, and prominence — reflects Google’s documented local ranking factors of relevance, prominence, and distance. Run a scan of your own business to see your actual map.
See your real map, not your flattering number
Run a GeoGrid scan of your own business and watch your rankings change block by block — then use the map to widen your green zone.