Live Preview
Your Rankings, Visualized
Every cell represents a search from a different location. See exactly where you dominate and where competitors outrank you.
GeoGrid Scan
7×7 Grid · 5 mi radius
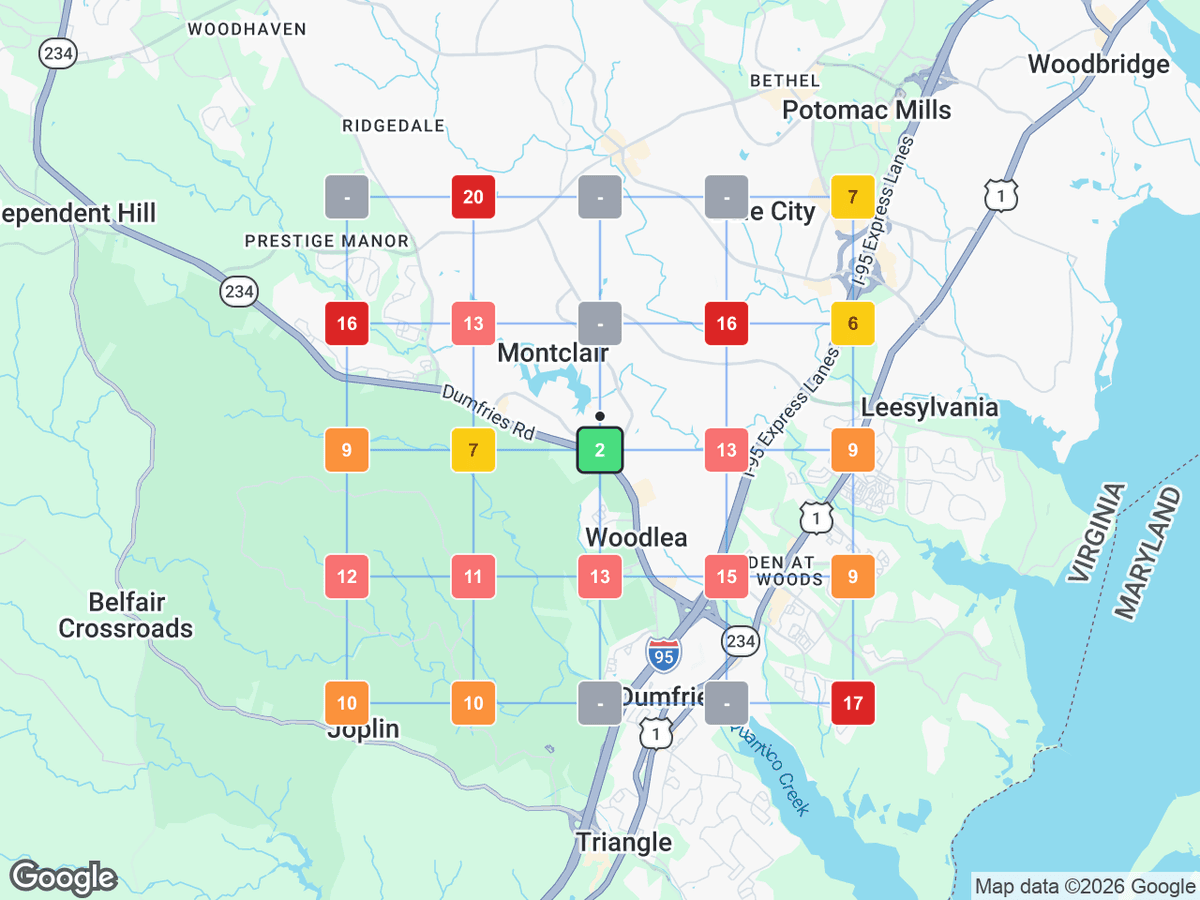
Avg Rank
8.4
Top 3
24%
Visibility
84%
Simple Process
How It Works
Step 01
Place Your Grid on the Map
Click anywhere on the map to center your scanning grid. Target your business location, a competitor, or any area in your market.
Step 02
Choose Grid Size & Radius
Select from 5×5, 7×7, or 9×9 grids. Set your scan radius from 1 to 50 miles to cover your entire service area.
Step 03
Get Instant Rank Data
See your rank at every grid point with a color-coded heatmap, plus full competitor analysis and quadrant breakdown.
Capabilities
Everything You Need to Dominate Local
GeoGrid gives you the complete picture of your local search presence with powerful analysis tools.
Color-Coded Heatmap
See your rank at every grid point with intuitive color coding — green for top positions, red for areas that need work.
Click-to-Place Grid
Position your scanning grid anywhere on the map. Target specific neighborhoods, competitor locations, or service areas.
Competitor Analysis
See which competitors rank at every grid point. Understand who dominates each micro-area of your market.
Quadrant Analysis
Break your grid into quadrants to identify your strongest and weakest geographic areas at a glance.
Printable Reports
Generate full PDF reports with the heatmap snapshot, stats, and competitor data. Perfect for client presentations.
Scan History
Track how your rankings change over time. Compare scans week-over-week to measure the impact of your SEO efforts.
Grid Options
Choose Your Scan Size
Larger grids give you more data points for a detailed view of your ranking landscape.